SPATIAL ANALYTICS & URBAN SYSTEMS
Bridging spatial econometrics, GIS modeling, and ground-level ethnography to evaluate urban accessibility, network density, and infrastructural dynamics. Projects leverage QGIS, ArcGIS Pro, and R for spatial analysis and cartographic visualization.
From Spatial Data to Decision Clarity
Spatial econometrics, GIS analysis, and ethnographic research designed to identify patterns, test assumptions, and support stronger urban investment and planning decisions.
Pedestrian & Catchment Analysis
Moving beyond simple straight-line distance to examine how people actually reach services, businesses, transit, and other urban assets.
Methods: Isochrone analysis, network accessibility, GIS routing, pedestrian friction modeling, and ethnographic go-alongs.
Deliverables: Catchment maps, accessibility layers, spatial friction audits, and decision-ready GIS outputs.
Environment: QGIS / ArcGIS Pro / R
Spatial Econometric Modeling
Testing how geography, demographic change, accessibility, infrastructure, market conditions, and other spatial factors relate to measurable urban outcomes.
Methods: OLS, panel regression, nonlinear modeling, spatial autocorrelation, spatial regression, and exploratory statistics.
Deliverables: Reproducible models, statistical outputs, mapped results, visualizations, and analytical briefs.
Environment: R / Stata / GeoDa
Corridor, Market & Service Networks
Mapping how transit, healthcare, commerce, and public services interact with population distribution, mobility, and neighborhood demand.
Methods: Spatial multi-criteria analysis, catchment modeling, network analysis, demographic mapping, and ethnographic observation.
Deliverables: Opportunity maps, service-gap analyses, corridor assessments, interactive spatial layers, and advisory briefs.
Environment: QGIS / R / ArcGIS Pro / Spatial SQL
Selected spatial analyses and applied research projects. Click any project to view the full methodology, findings, and interpretation.
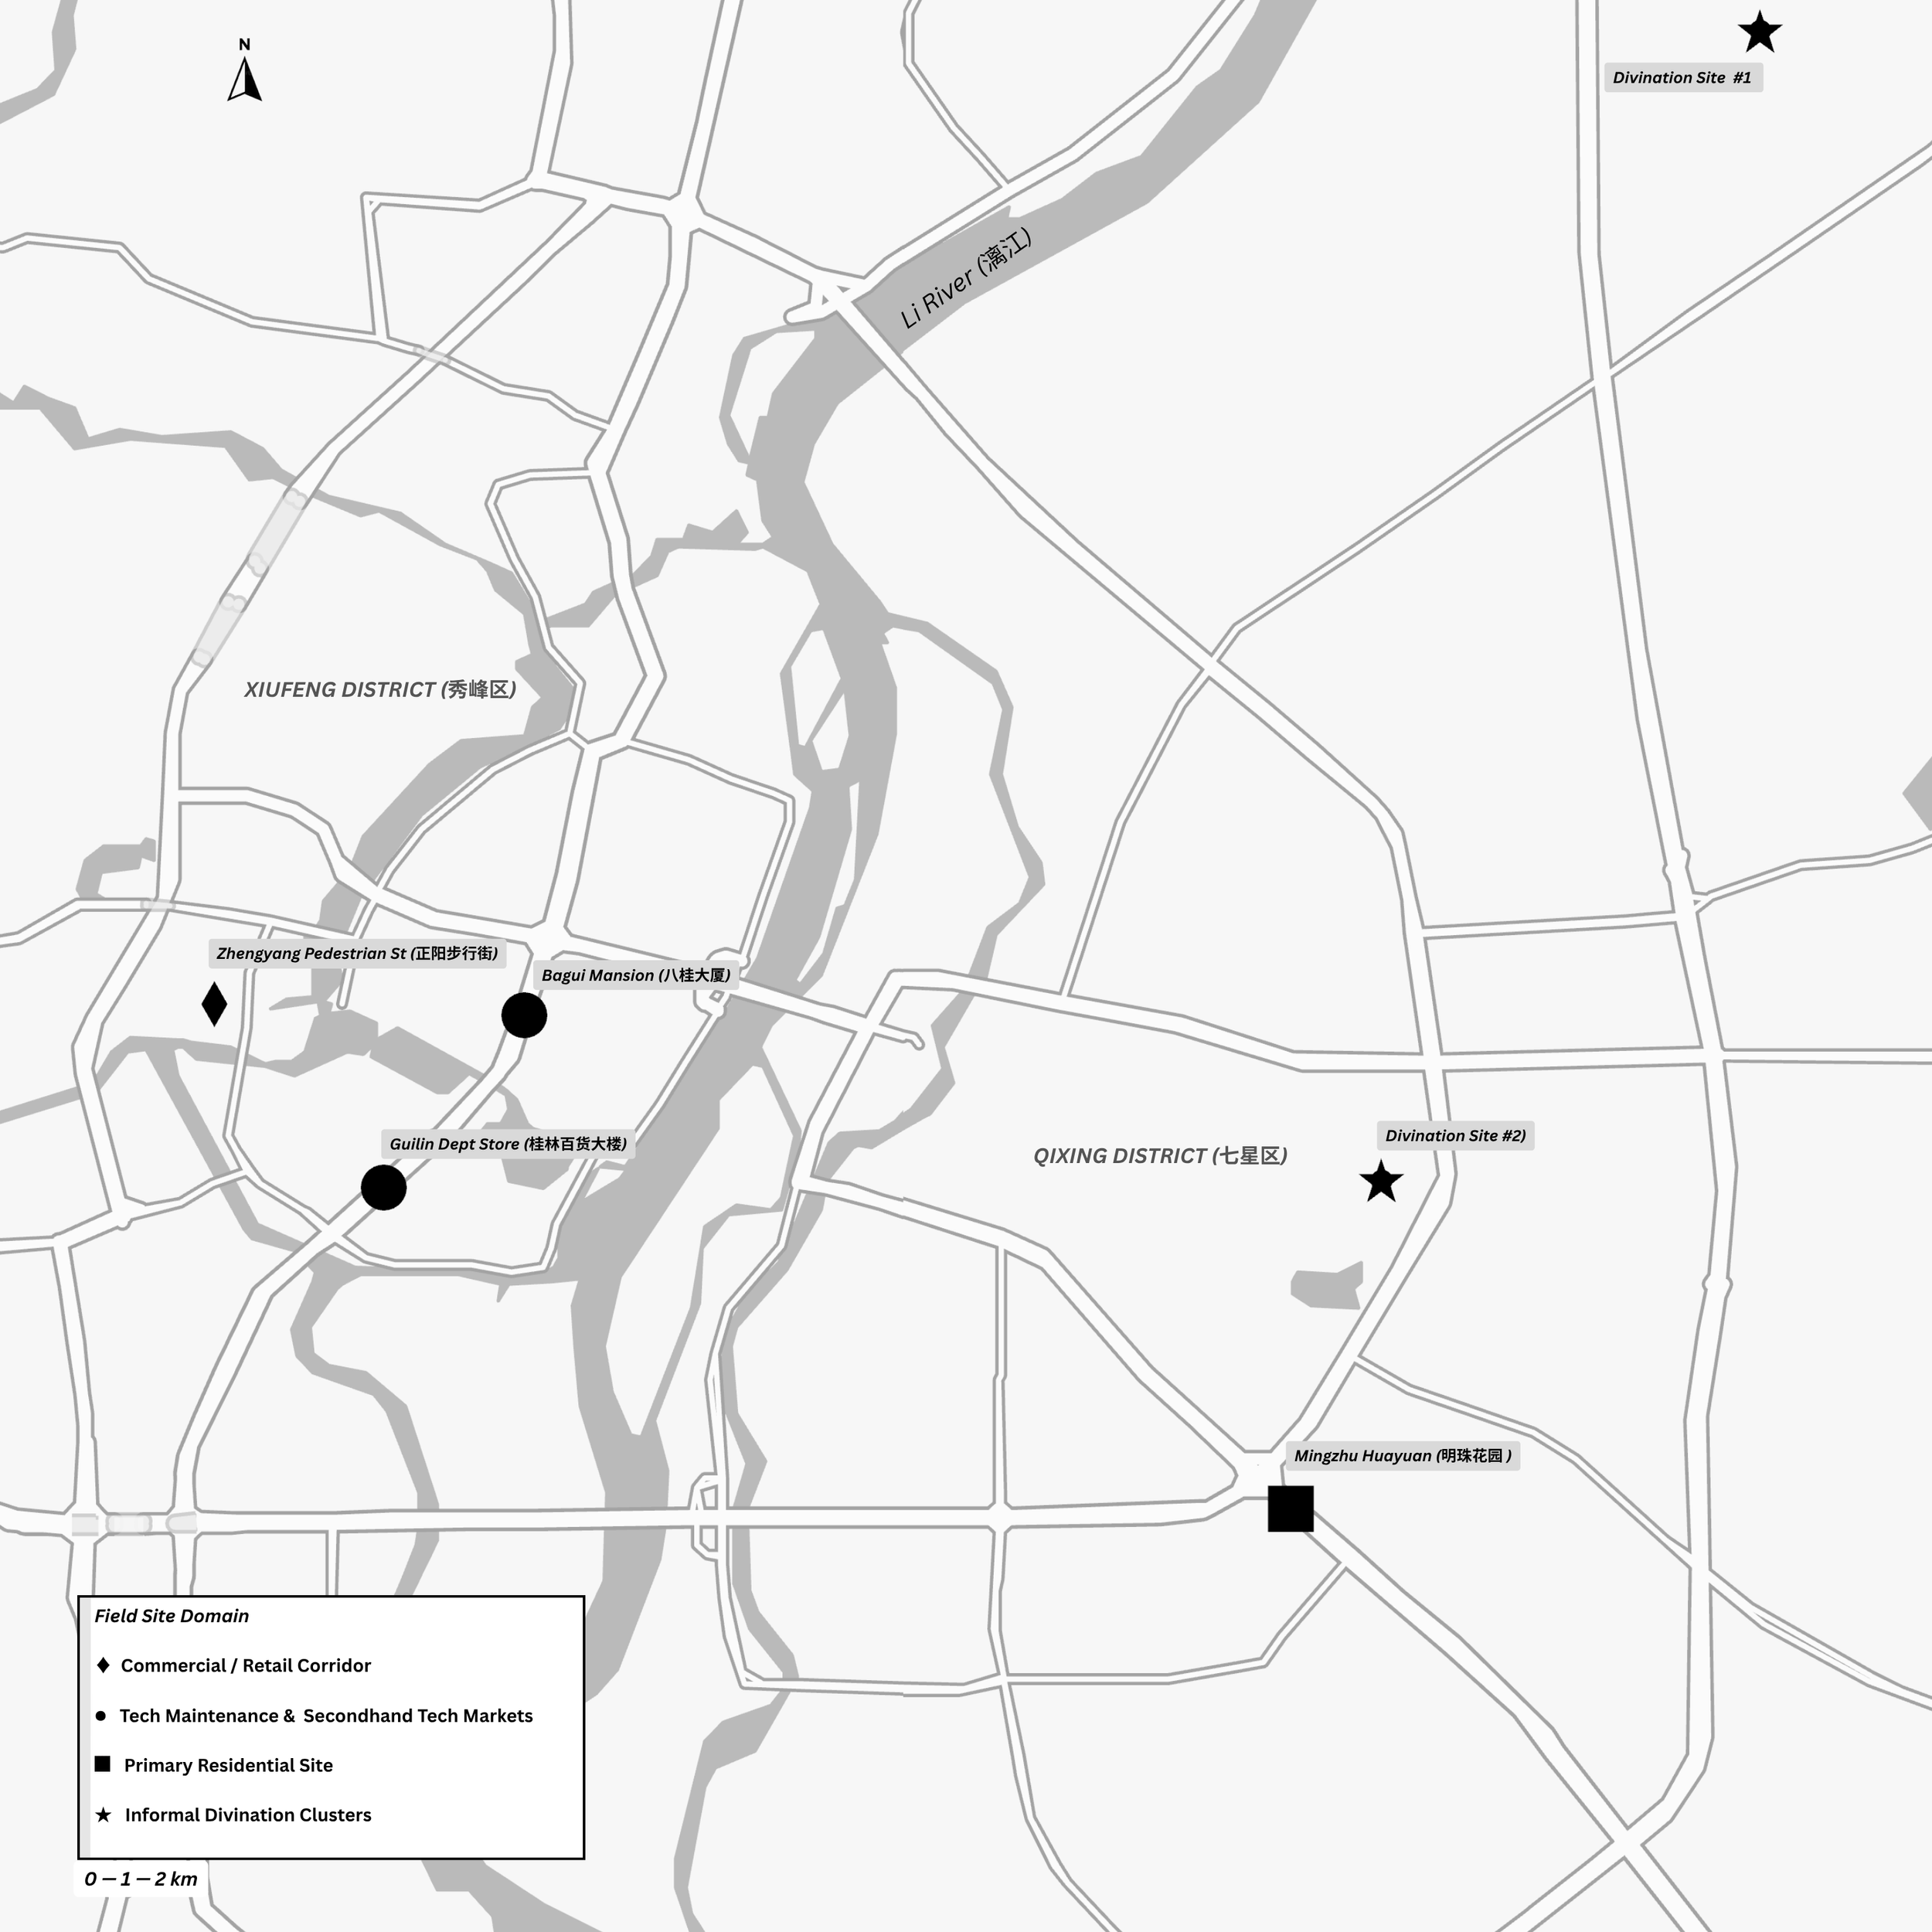
(CARTOGRAPHIC FIELDWORK // GIS) SPATIAL TYPOLOGIES OF INFORMAL CARE & URBAN COMMERCE (GUILIN, CHINA)
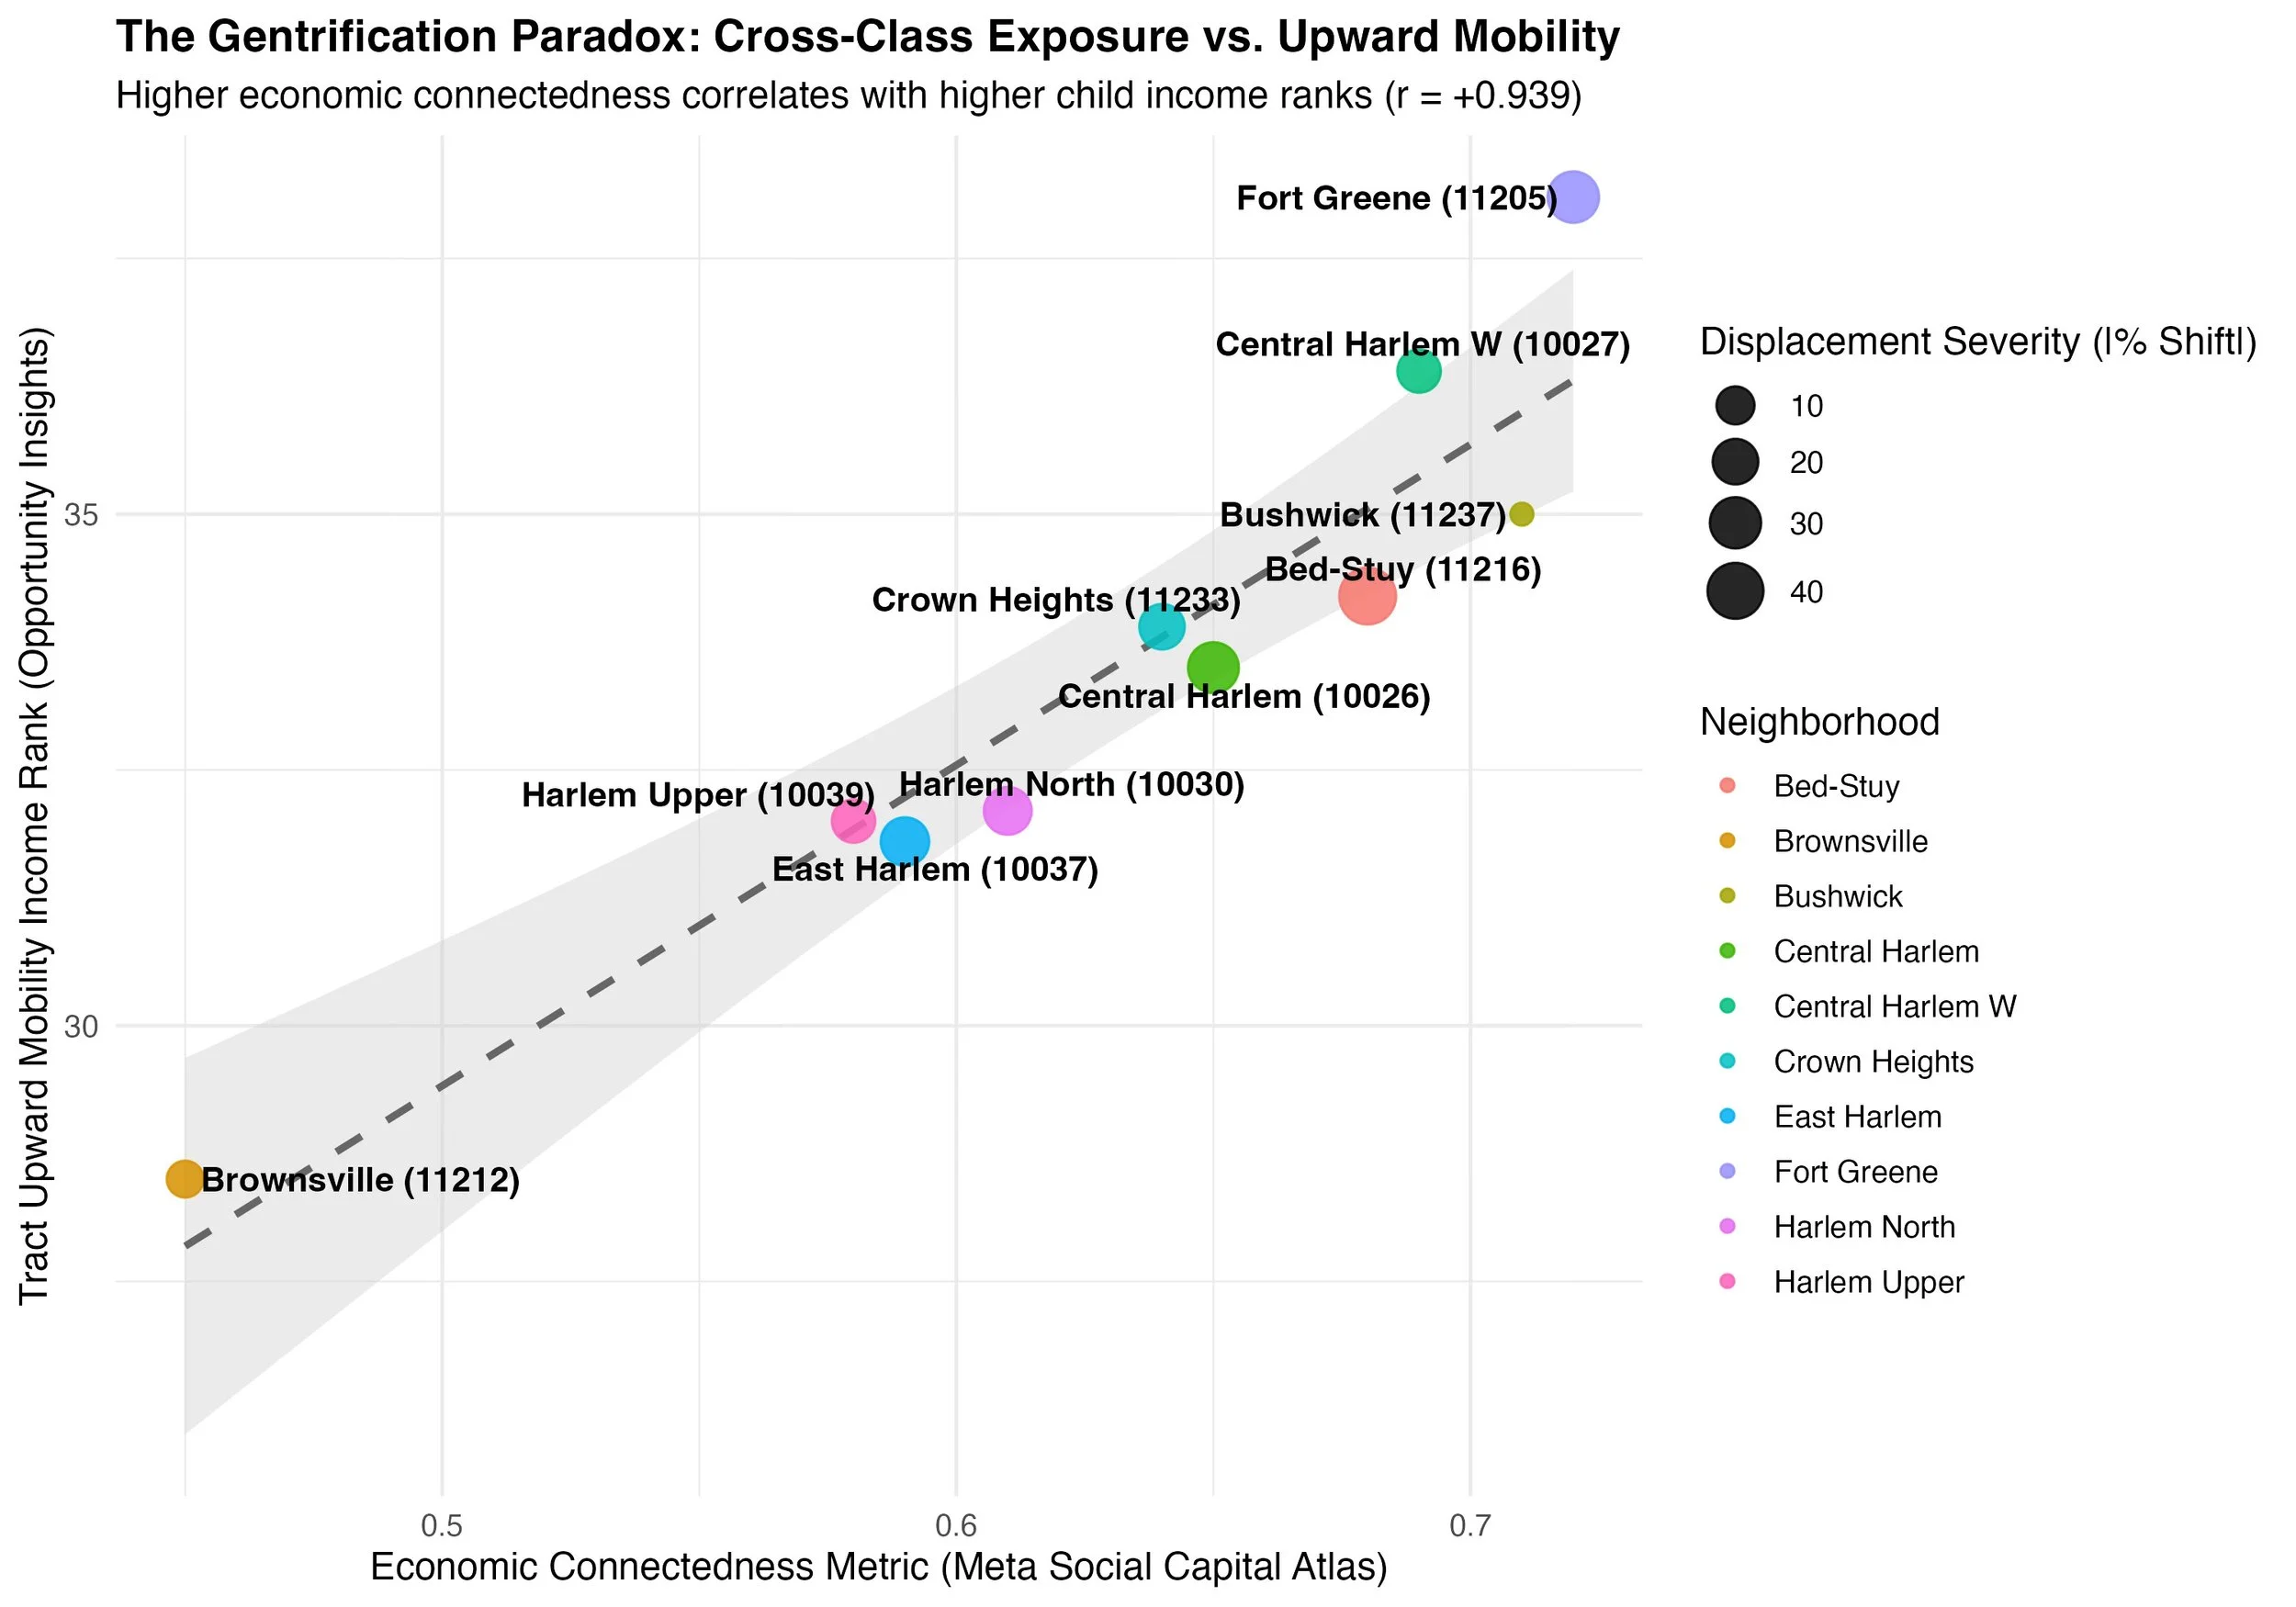
(ECONOMETRIC MODELING // SOCIAL CAPITAL) THE GENTRIFICATION PARADOX
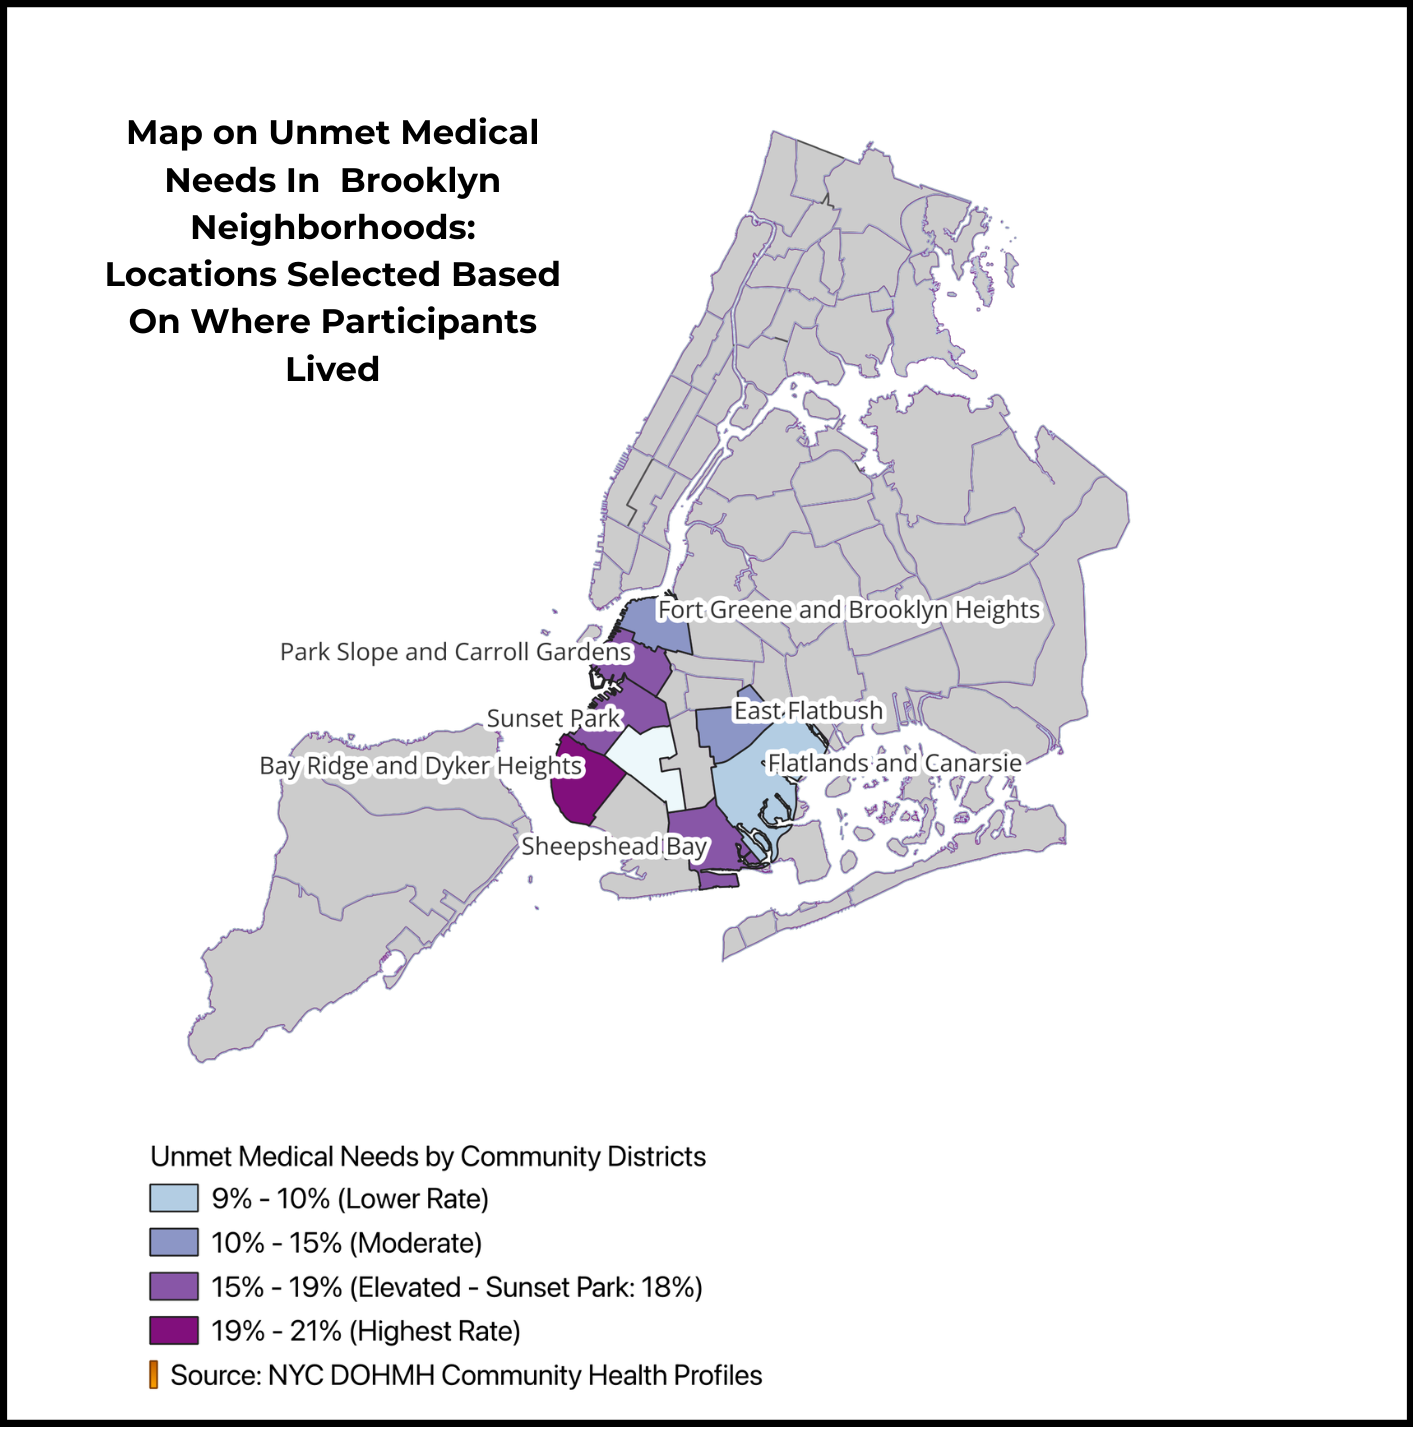
(HEALTHCARE) THE HEALTHCARE ACCESS DIVIDE: GEOGRAPHIC CONCENTRATION OF UNMET NEED