The Gentrification Paradox: Social Capital vs. Displacement
R / ggplot2 • Opportunity Insights • Econometrics
When sociologists and economists measure neighborhood opportunity, Economic Connectedness or the frequency of cross-class social ties between low- and high-income residents—is often hailed as the ultimate key to upward mobility.
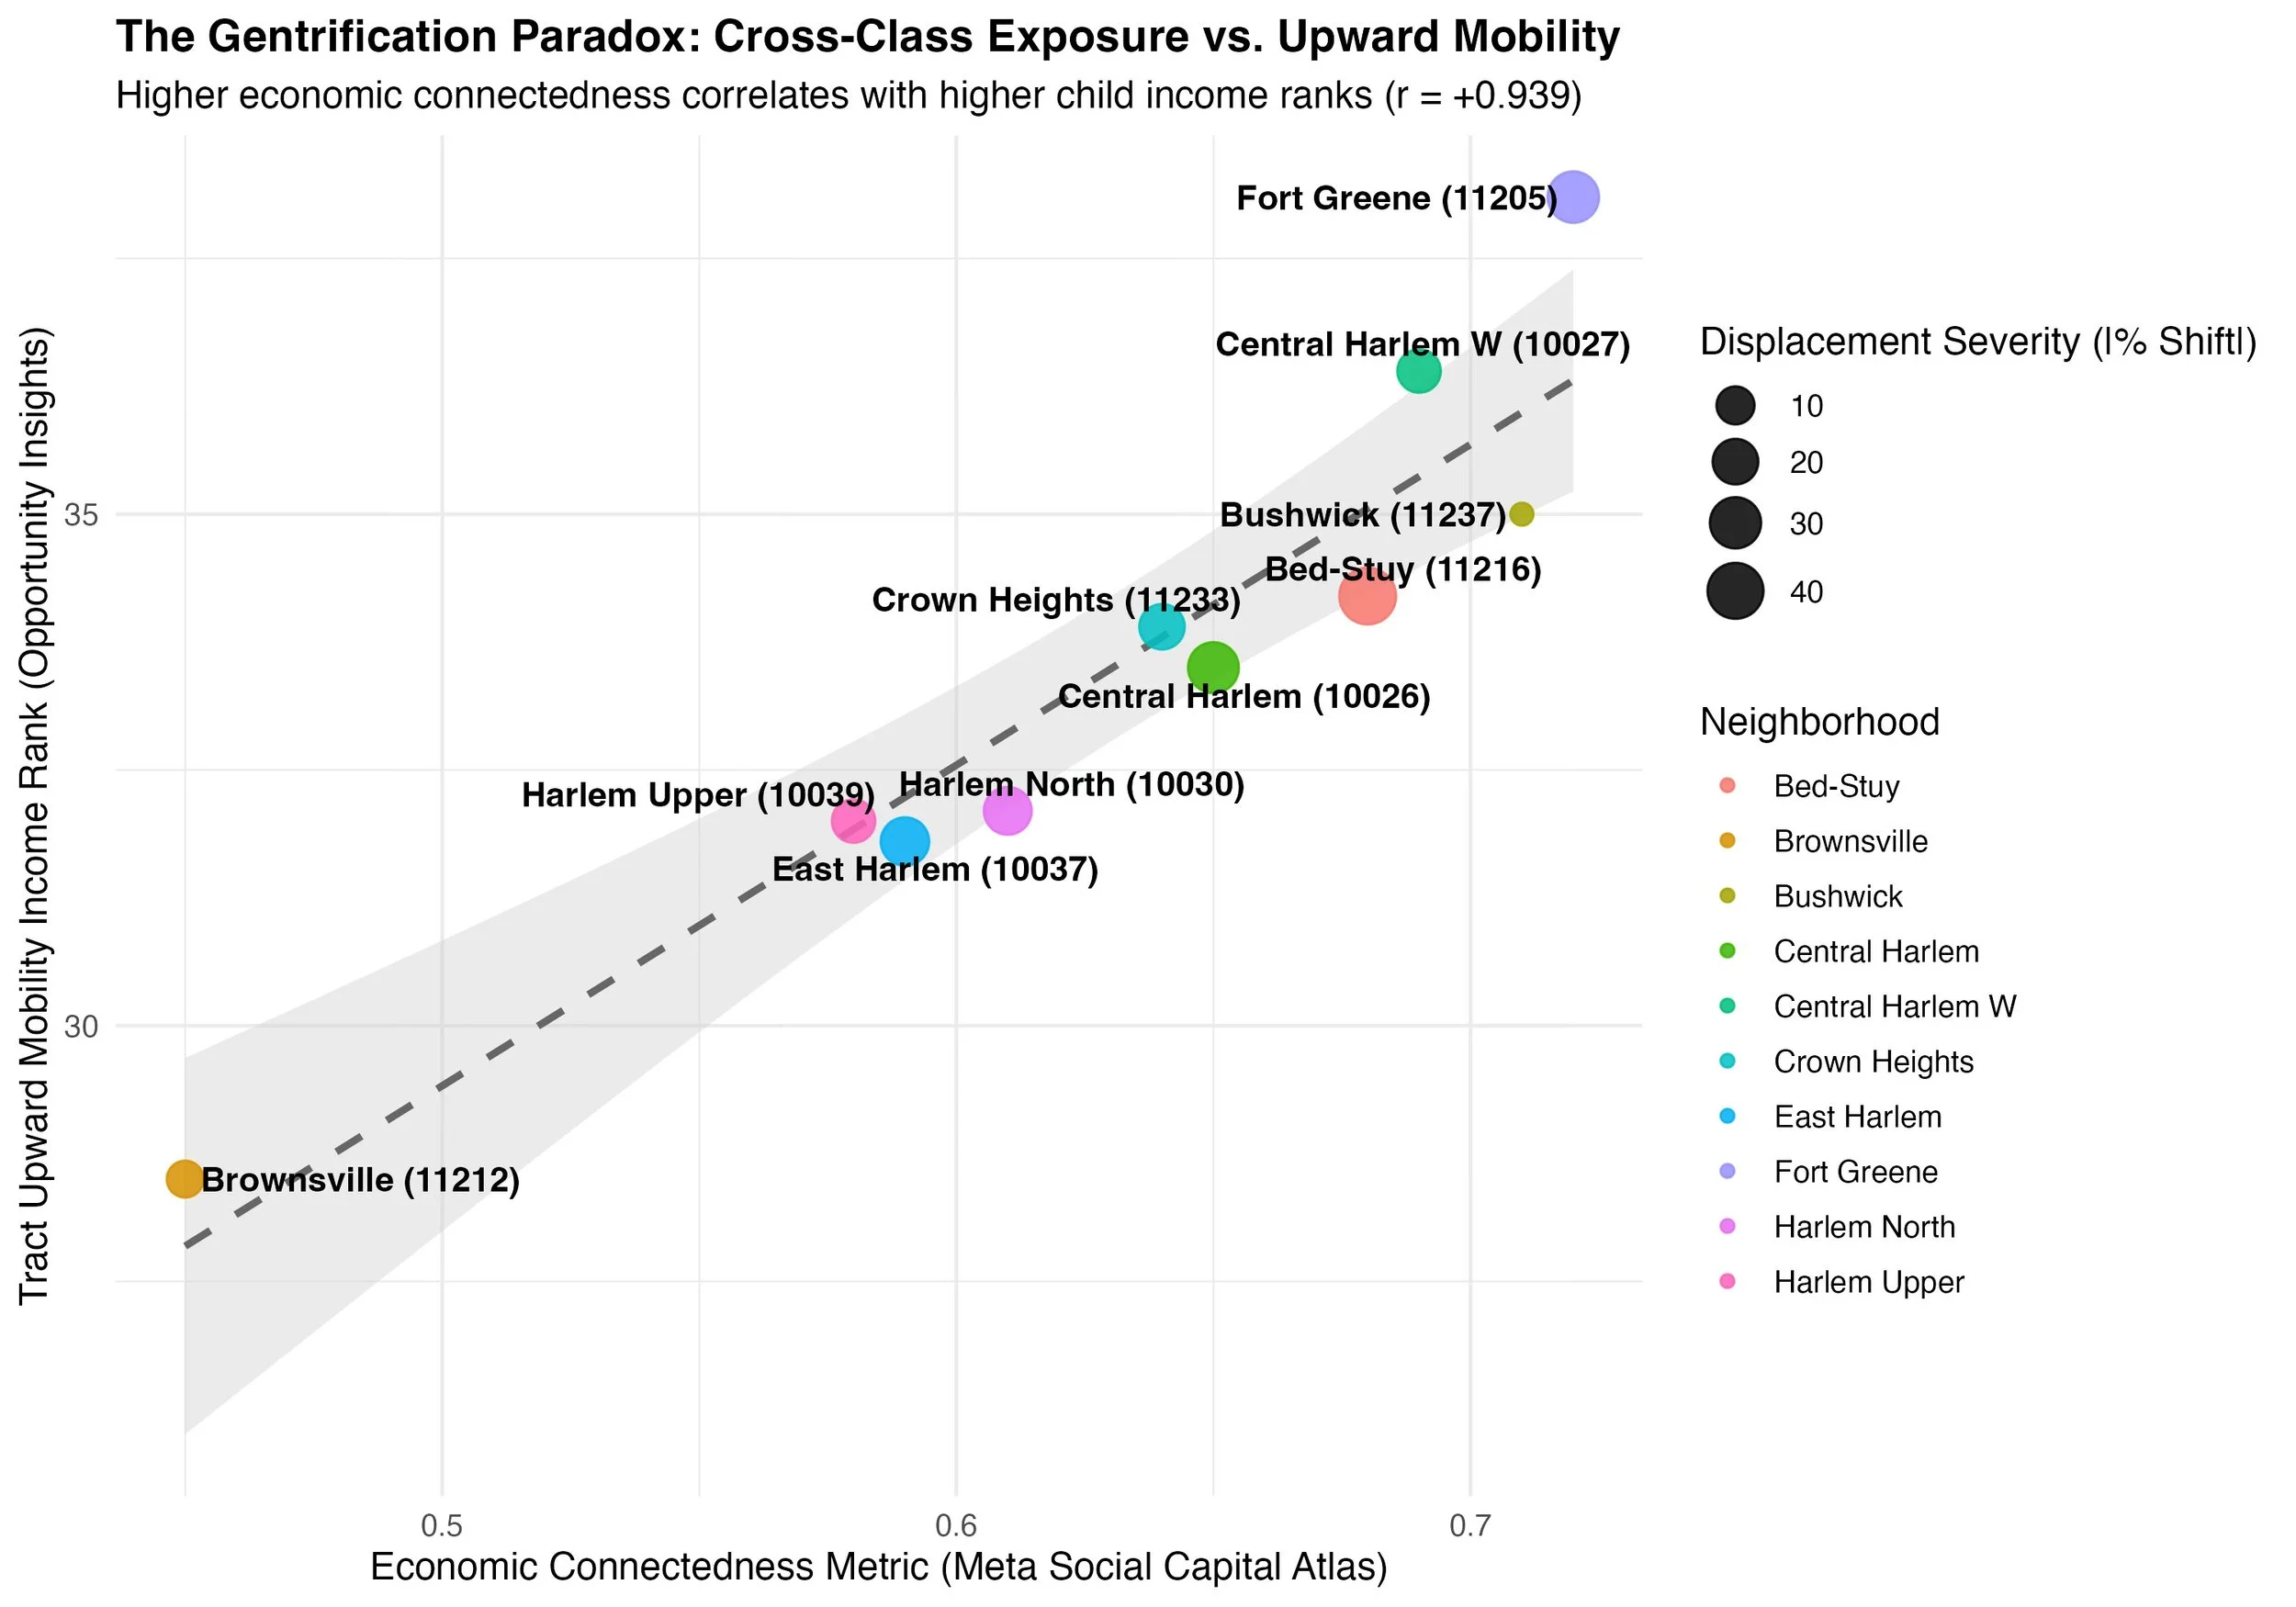
On paper, the data across Brooklyn and Harlem proves the rule. There is a near-perfect positive correlation (r = +0.939) between a neighborhood’s economic connectedness metric and the upward mobility rank of children raised there.
HOWEVER!
Look at the size of the points representing 20-year demographic displacement. The neighborhoods exhibiting the highest economic connectedness and mobility ranks—such as Fort Greene (0.72 connectedness, 38.1 mobility rank), Bed-Stuy (0.68, 34.2), and Central Harlem W (0.69, 36.4)—are the exact corridors that suffered massive Black population loss between 2000 and 2020 (-30.4%, -42.0%, and -16.7%).
Meanwhile, un-gentrified corridors like Brownsville maintain low displacement (-8.8%), but remain isolated with low economic connectedness (0.45) and lower mobility outcomes (28.5).
The paradox of modern urban development lies in the structural mechanisms that increase cross-class exposure and spatial opportunity. However, these mechanisms often do so via gentrification and market pressure that end up displacing the very historic communities those networks are meant to uplift.